Project McNulty - SQL Database Management, Supervised Learning with Classification and Visualization
Projects | | Links: Related Posts

Initial Contact
Greetings Mr. Hamilton…
Or can we call you Joe?
You see Joe… that’s a mighty fine blog ya got there. Wouldn’t want anything to happen to it, now would we? We’ve decided to help you out a bit… yeah… that’s the ticket.
In order to protect your site a bit we’ve locked it down for you to free you up a bit to help us out.
We’re in the market for a bit of relocation, ya might say…. yeah!
We’s wondering if you might be able to help out with some analysis. We’d like to know where in Chicago crime reports have more or less of a chance to end up with an arrest. We’re concerned about… safety… yeah… that’s the ticket.
Let us know what you can do.
Blog Locked

Uh oh… Well, this ought to be an interesting Data Science opportunity…
So I found relevant data from the Chicago Data Portal. A bit of data manipulation to create a convertor to map from the SODA format the traditional SQL and I was ready to do some analysis.
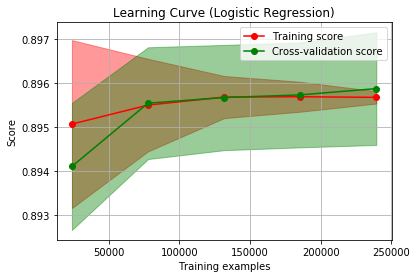
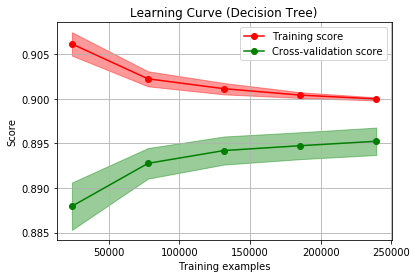
Initial modeling seemed to suggest I should use the Chicago Data Portal’s crime data to predict whether a crime report in a given location would result in an arrest. A bit of underfitting with logistic regression. Somewhat overfitting with decision tree. But sitll… getting accuracy of 90%. It seemed time to report.
Initial Response
Greetings,
I have been able to access the Chicago crime report data to provide you a classification analysis resulting in approximately 90% accuracy. Example learning curves:
Feedback
Joe,
Yeah… We’ve taken a look at your work. We’re not sure this is all that helpful. We don’t need no government telling us most of the time people don’t get arrested. We knew that.
And the boys already got a good feel which locations where arrests are more likely. Thing is, they can call it pretty good on their own. We need more than a focus on accuracy.
Let me spell it out for ya.
If you tell us something ain’t gonna lead to an arrest and it really does, that’s one of the boys off the street. Fewer workers hurts the bottom line, capiche?
But if your predictions scare us off because you’re sure of an arrest and it weren’t gonna happen, then that’s a prime case of a lost business opportunity. You get it?
Get back to work!
More modeling
Ahh… that helps. There are several ways to assess the performance of classification models.
Accuracy is the percentage chance you called it right - you said True and it was True or you said False and it was False. But for this data, a dumb model which always said False would have an accuracy score over 70%.
For this client, I need to use other metrics. The score focused on minimizing Type II errors is Sensitivty. Type II errors are more commonly known as False Negatives. The model would predict negative, while reality is positive. That’s a prediction of no arrest which proves to be false.
Next, the score minimizing Type I errors is Precision. A high precision score means the model is less likely to make Type I errors - False Positives - where the model predicts arrest and gets that wrong.
A good metric which combines both of these is the F1 score.
Blog unlocked
I provided updated modeling with a focus on these metrics along with a flask-based app to help them predict “safety”.
This pleased the client enough that the blog was unlocked.